GAS-AVAILABLE#1 PASSENGER CAR
U.S. MARKET STUDY · 2016—2025
Ten years of U.S. leaders: the top passenger-car nameplate offering a gasoline trim versus the top battery-electric vehicle. What changes beyond the price tag?
Explore the comparisonPopularity, not matching body styles. We compare the top-selling U.S. passenger-car nameplate with a conventional gasoline trim to the top-selling U.S. battery-electric nameplate. A Model Y crossover can therefore face a Camry sedan. Sales are calendar-year totals; prices are documented representative trim MSRPs from the period.
02 / HEAD TO HEAD
All dollar values are U.S. dollars. Ownership and resale figures are modeled scenarios, not observed year-specific transaction prices.
THE MONEY
Selected cost = depreciation + energy + maintenance/tires + insurance. Resale is MSRP × a historical model-level retention benchmark; each component is a synthetic scenario, not a forecast or complete/model-specific total-cost-of-ownership quote. Excludes tax, financing, charging installation, incentives, and registration.
ADJUST THE SCENARIO
Change the operating assumptions. MSRP and resale percentage stay fixed; in reality, mileage can change resale value too. The calculator does not model that relationship.
THE EXPERIENCE · GENERAL TRAITS
Representative efficiency and generation-level traits; equipment and ratings vary by trim, year, and configuration.
GAS-AVAILABLE
BATTERY ELECTRIC
03 / THE LONG VIEW
Click any row to jump back into the head-to-head view. Sales totals are nameplate-level estimates or manufacturer reports, not trim-level sales.
04 / SHOW YOUR WORK
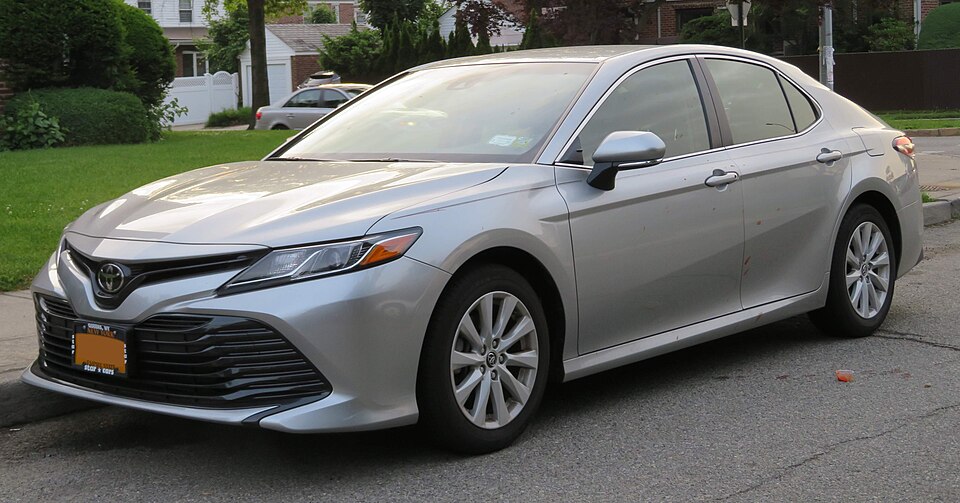
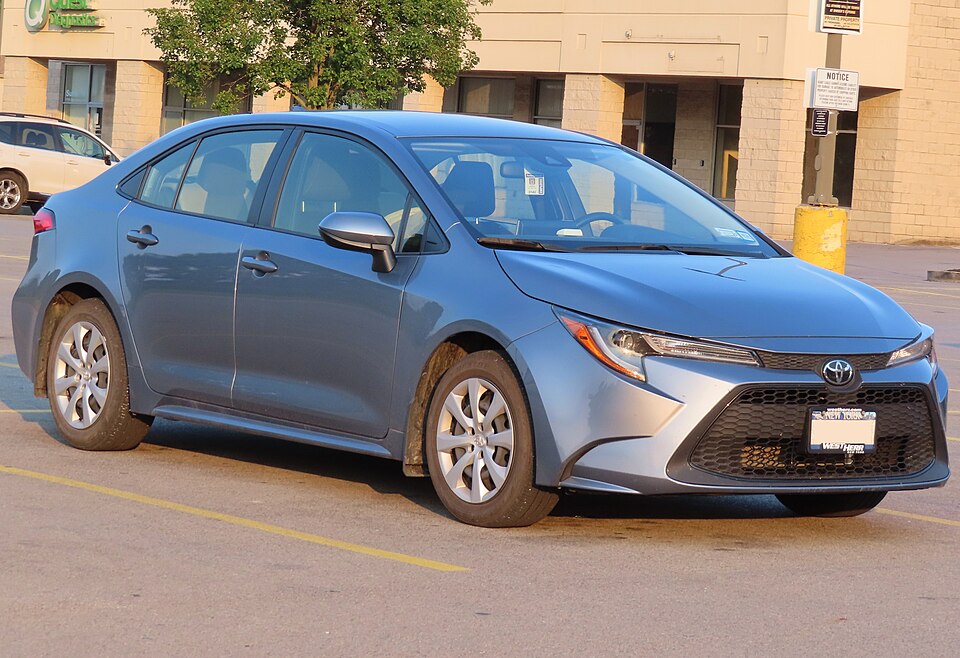
A passenger-car nameplate must offer a conventional, non-hybrid gasoline trim for that model year. The sales total is the entire nameplate, because manufacturers do not consistently split every trim. The 2025 Camry is excluded: the new model is hybrid-only. The Corolla, with gasoline LE trim, takes its place. The 2025 Corolla photo shows the same E210 generation, but is a photographed 2021 car.
We use each year's selected trim MSRP, then apply five years of miles, gas or electricity, maintenance/tires, insurance, and a depreciation benchmark. Defaults: 15,000 miles/year; $3.25/gallon; $0.17/kWh. Maintenance/tires and insurance use AAA 2025 medium-sedan category proxies for both sides, even when the selected car is not a medium sedan: gasoline 11.91¢/mile and $1,572/year; electric 9.05¢/mile and $2,027/year. These are not model-specific quotes. Gas MPG and EV kWh/100 mi are rounded EPA combined values for the linked representative trims; confirm other configurations at FuelEconomy.gov ↗. Historical retention benchmarks from a 2025 iSeeCars study: Camry 64.5%, Corolla 68.6%, Model S 34.8%, Model 3 44.1%, Model Y 39.6%. That study measured five-year-old cars sold March 2024–February 2025 and inflation-adjusted original MSRPs. We apply its percentages to nominal model-year MSRPs without inflation adjustment, purely to create a comparative scenario—not an observed or forecast resale amount. Mileage affects operating cost here but not the resale benchmark. KBB revises EV sales estimates; 2023 uses its revised 2024-report figure.
Federal/state EV credits, sales tax, registration, financing interest, home-charger installation, public-fast-charging premiums, local insurance quotes, repair surprises, and time spent refueling/charging. Tesla prices changed frequently within calendar years; shown MSRPs are a documented representative price, not a claim that every buyer paid it. This is an editorial comparison of best sellers, not a matched-size vehicle shopping recommendation.
Camry sales series ↗ · Toyota 2025 sales ↗ · KBB EV sales ↗ · iSeeCars depreciation study ↗ · AAA ownership benchmarks ↗ · EPA fuel economy ↗
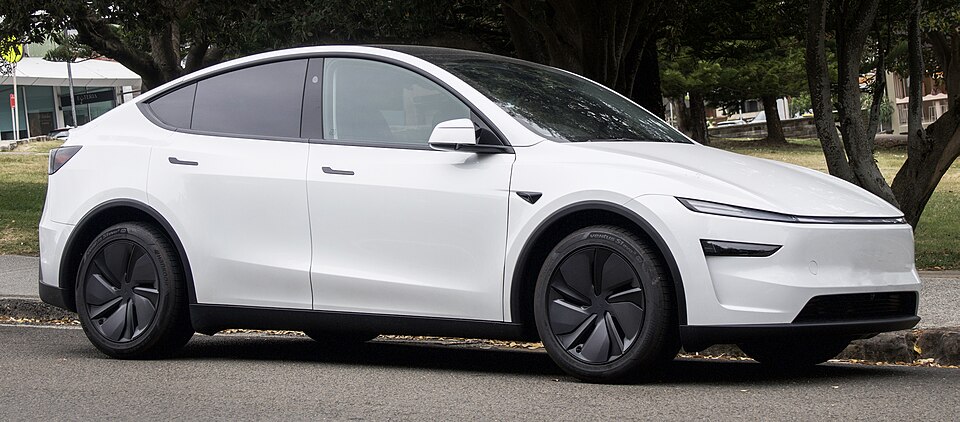
Each selected car card has annual price and sales links. Car photographs: Wikimedia Commons, CC BY-SA 4.0. Individual author and file links are listed in photo credits ↗. Photographs are illustrative; year labels identify the photographed car where they differ from the comparison model year.